- Marine Geotechnics
- Marine Geotechnics Lab
- Direct Shear
Direct Shear
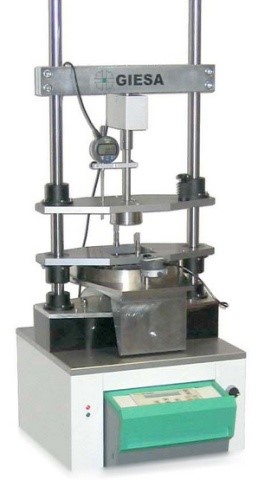
GIESA

In this device, the sample cell is a stack of two steel plates which house the cylindrical sample. Normal load is applied to the top face of the sample with a vertical ram, and the lower plate is displaced horizontally relative to the top plate by an electric motor, inducing planar (i.e. localized) shear deformation in the sample. The device is proven capable of employing shearing at rates at least as low as ~5 cm/yr, satisfactorily matching a large number of plate tectonic slip rates. For example, in order to generate a driving velocity of 8.5 cm/yr (the rate in the Japan Trench and Costa Rica), the apparatus utilizes a stepper motor with an update rate of 0.19 Hz and a step width of 0.015 µm; recorded data at 0.033 Hz (or 10 measurements every 0.81 µm defined by the displacement sensor resolution) results in a time-averaged displacement rate of 2.7 nm/s (= 8.5 cm/yr). Both the Giesa direct-shear and the rotary shear devices are appropriate for room temperature and low pressure (< 20 MPa) conditions, equivalent to a few km deep in the Earth’s crust.
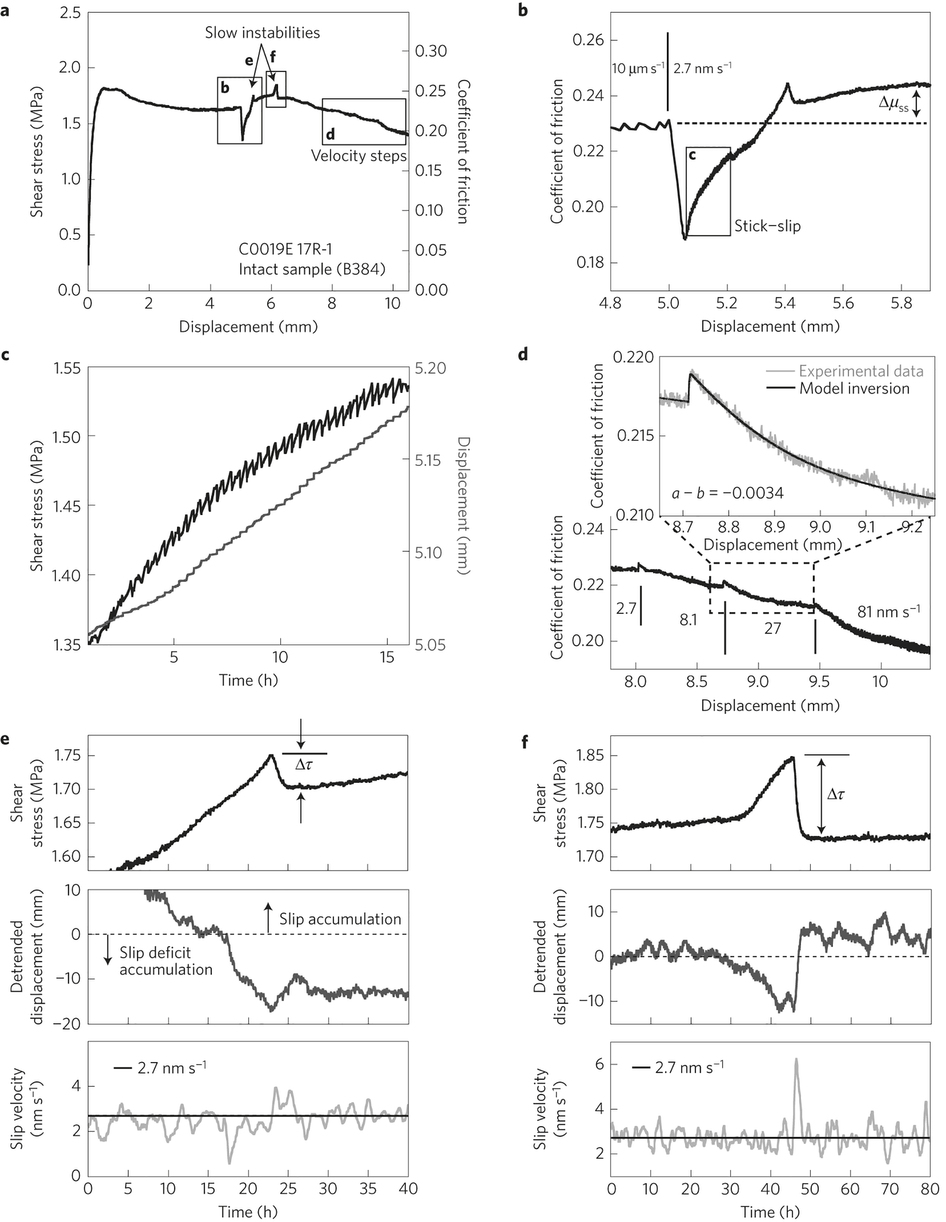
a, Example of shear stress and friction data for an intact sample of the JFAST plate-boundary fault zone (Core 17R-1). Boxes and arrows indicate close-up views in following panels.
b, Close-up view of friction data showing the decrease from 10 μms−1 to 2.7 nms−1. Δμss indicates the change in steady-state friction used to calculate a − b. Box indicates the close-up view shown in c.
c, Close-up view of stick–slip behaviour, showing shear stress and displacement as a function of time. Advances in displacement correlate with stress drops.
d, Close-up of threefold increases in velocity. Inset shows a close-up view of the 8.1–27 nms−1 velocity-step data, overlaid with an inverse model from which the value a − b = −0.0034 is obtained.
e, The first slow instability in a, showing the shear stress (top), displacement of the sample detrended for the remotely imposed slip velocity of 2.7 nms−1 (middle), and the time-averaged instantaneous real slip velocity of the sample (bottom) as a function of time. Δτ = stress drop. Detrended displacement set to 0 at the beginning of the event loadup phase; decreasing values indicate slip deficit and positive values indicates slip accumulation. Solid line on the velocity plot indicates the prescribed driving velocity of 2.7 nms−1 for comparison.
f, Same as e, for the second slow instability in a


