Logo Universitat Bremen
Page path:

Chlorophyll concentration with MITgcm

Jul 15, 2022
MITgcm
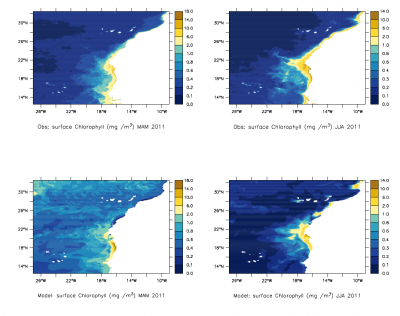
Surface chlorophyll concentration for spring (left) and summer (right), based on satellite measurements (top) and for the MITgcm simulation (bottom). Satellite data from the ESA Climate Change Initiative Ocean Colour project, ESA OC-CCI, was provided via the Copernicus Climate Data Store (CDS).


In the Modelling Enabler RECEIVER, we set-up a regional version of the MIT general circulation model (MITgcm) for the Northwest African Upwelling system. Besides, we extended the existing biogeochemistry module of the MITgcm to allow for future coupling to a particle aggregation model. In particular, an explicit representations of phytoplankton, zooplankton, and detritus were implemented, as well as an implicit sinking scheme for particles.

Multi-annual simulations were carried out and the relevant upwelling dynamics and the interannual surface temperature variability were captured satisfactorily. Comparison of biogeochemical modeling results (bottom) with observations (top) is underway and has already shown encouraging results. Examplarily, spring (left) and summer (right) surface chlorophyll concentrations for the year 2011 are compared to satellite data. In particular the large offshore extend of the Cape Blanc filament in summer is simulated well.