
Page path:
Color reflectance
Color reflectance is measured on the archive half of a core soon after splitting to avoid color changes that might occur due to the exposure of the split surface to the atmosphere. In the following you will find details to operate the Minolta spectrophotometer CM 2600d, which is used for the color reflectance measurements either on the MSCL track or in handheld mode.
Color reflectance (handheld system)

Core preparation
- Take the color measurements at constant periods after the core has been split, such as about 1 hour (ODP PP Handbook, Peter Blum, 1997).
- The sediment surface must be as flat as possible.
- Cover the sediment surface with the special foil (Hostaphan). It is better than cling wrap because of improved adhesion on the sediment surface.


Connection to laptop
- Insert the USB-Dongel “ Aladdin” at the back of the laptop.
- Connect the laptop with the gray cable (yellow sign with Minolta 2600d) to the spectrophotometer CM 2600d.
- Connect the spectrophotometer CM 2600d and the laptop with the wall socket.
- Open the Spectramagic CMs100w application.
- Click on "file", "new" and then "new document".
- Click now again on "file", then "template", "load template".
- You will find the OSP_template under C:\\Spectrophotometer_OSP
Measurement conditions
On the display of the spectrophotometer you can find Condition 1 to Condition 6. All Conditions have got the same measurement conditions as follows:
Mask/Gloss: M/SCE
UV Setting: UV 100%
Illuminant 1: D65
Illuminant2: - - -
Observer: 2°
Display: DIFF & ABS
Color Space: L*a*b*, ∆E*
Manual avg.
Times: - -
DeviationSCI - - -SCE - - -
Auto AVG: 1
Delay time: 0.0s
For each section you use one condition: Cond 1 for section 1, Cond2 for section 2 and so on.
If you want to have other measurement conditions, you have to select “file” at the display of the instrument and change the conditions.
Note: The SCE setting is the recommended mode of operation for sediments in which the light reflected at a certain angle is trapped and absorbed at the light trap position on the integration sphere. Minolta recommends the SCE settings for general purpose while the SCI setting is useful for color mixing or computer color matching. (ODP PP Handbook, Peter Blum, 1997).
Calibration
In the instrument´s menu choose “Calibration”
Before starting the measurement perform the Zero Calibration (every 24 h): Adjust the Zero Calibration Box on the spectrophotometer. Press the measuring button on the right hand side of the instrument. Wait until 3 measurements have been taken (3 flashes).
Remove the cap from the White Calibration Piece and attach the piece to the instrument which is now covered by the dust cover. Press measuring button and wait until 3 measurements have been taken (3 flashes). Do not cover the white calibration piece with foil!
Measurements
Have a look at the display and make sure you are in the right condition (Cond1 for Section 1 etc.)
With the navigator wheel move to “break” by turning it to right or left and then press the navigation wheel.
On the display of the instrument you can see in the first row: flash – cond x – M/SCE/100 – no data.
On the left hand side of the display you can read L*, a* and b*.
The needle in front of the instrument and on the left hand side are arranged to precise the positioning of the instrument. Before starting with the sediment, take first one measurement of the White Calibration Piece. Set the instrument gently on the sediment surface and hold it orthogonal to the core surface.
Press the measuring button on the right hand side of the instrument and wait until a flash occurs.
The measured data is now shown on the display.
Put the instrument gently on the next point you want to measure. Press the measuring button. The measurements are counted as No. 1, No. 2 and so on on the display in the first row for each condition.
For each section choose a new condition. Attention: You can measure 6 sections or 690 measure points in total (all 6 conditions together) before loading the data to the Laptop!!
Avoid measuring cracks because the measurement result will be useless and will degrade the value of the core profile (PP Handbook, Peter Blum, 1997).
Regularly clean in a gentle manner the protective glass cover on the aperture of the instrument with a Kleenex.
At the end of each section take a control measurement using the White Calibration Piece.


Continue measurements
When all 6 conditions have been uploaded to the laptop and have been saved, go back to the instrument, press the navigation wheel to quit the remote modus. Select one condition after the other for deleting the present data (choose therefore “data delete” - yes by turning and then pressing the navigation wheel).
Continue measurement with cond1, cond2 etc.
Reference
www.iodp.tamu.edu
PP Handbook, Note 26, Peter Blum, 1997: Chapter 7., Reflectance, Spectrophotometry and Colorimetry
Uploading data to laptop
Choose “menu” on the display of the instrument, press the navigation wheel. Choose “remote” and press the navigation wheel.
On the screen of the laptop click on "instrument", "upload samples" (Bank1, close). Choose the right condition you want to upload, e.g. 3rd condition. Each condition has to be uploaded separately. Click "ok". The data upload proceeds now from the instrument to the laptop. You will find the data in the upper right panel.
In the upper left panel click on "samples" (first blue marked, after checking red marked). Save file with section ID.
Click on "file", "save selection as text", name the file with section ID. Highlight all data in the upper right panel and copy data to Excel sheet. Choose the right resolution, e.g. 4 cm. Fill in Exp, Site, Hole etc. in the first line. All others are created automatically. Name file with section ID.
Color reflectance (track system)
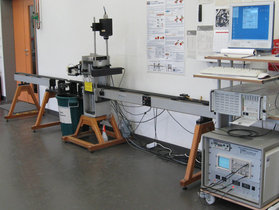
Spectrophotometer_MSCL-track: Quick start
1. Click on the program icon on the desktop: MSCL 7.9
2. Click on “Log New Core”
3. Click on "D:\geotek\_____".
4. Click: ok
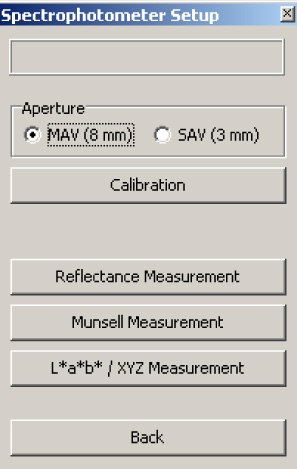
5. Fill in Core ID _______ in the next panel as well as the step size, e. g., 2 cm and click: spectrophotometer on, MAV and in case it is wanted click on Munsell (Note that this option increases the measurement time. See table below).
6. Click on show setup. Make sure the spectrophotometer opening is uplifted 11 cm above the track. Now click on zero calibration (everey morning and always after the instrument has been switched off). Wait until 3 flashes are done. Click on white calibration (every morning and always after the instrument has been switched off) after another person has placed the white calibration piece under the measurement window (white ring). Wait until the flashes are done.
7. Click: ok
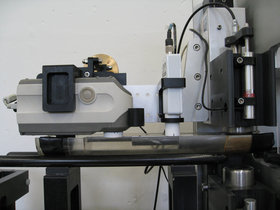
8. Now the Logger Control panel appears: with the acoustic motor in manual mode, adjust the spectrophotometer in the way that it touches the surface of the section and that the upper transducer escapes 5 to 10 mm in the housing (while touching the sediment surface). Put the motor back to automatic mode.
9. Click: ok, then type 25 or 40 (depending on the morphology of the surface), and click ok again: wait until the acoustic motor drives up the spectrophotometer for the chosen distance. Make sure that the spectrophotometer has got enough space between surface and measurement-window (white ring). It must be avoided that a core section can bump into the spectrophotometer.
10. With the pusher motor in manual mode move the pusher to the reference point (blue). Put the motor to automatic mode and click ok.
11. With the scroll bar move the pusher to the nominal position.
12. Place the section (covered with Hostaphan foil), adjust if necessary with the scroll bar and click on “begin scan”.
13. When the pusher comes to the reference point, it moves automatically back.
14. Place next section, adjust with the scroll bar if necessary and click on “begin scan”. Go on with the following sections.
15. When the last section of a core is almost done, use the dummy for pushing.
16. At the end of the core click on "File", "create ASCII file": save data in the right folder (same ID as the files).
17. Click on "Options", "Process data". A new panel appears.
18. Click on "Options", "Processing panel".
19. Click on "File", "create ASCII file": save in the right folder.
20.For the new core create a new folder. Continue with point 8.
More details ...
Turn off
Turn off the PC
Power off at microprocessor unit (below right)
Switch interface box off
Flip switch at the transformer box to "0".
1. Click on the program icon on the desktop: MSCL 7.9
2. Click on “Log New Core”
3. Click on "D:\geotek\_____".
4. Click: ok
5. Fill in Core ID _______ in the next panel as well as the step size, e. g., 2 cm and click: spectrophotometer on, MAV and in case it is wanted click on Munsell (Note that this option increases the measurement time. See table below).
6. Click on show setup. Make sure the spectrophotometer opening is uplifted 11 cm above the track. Now click on zero calibration (everey morning and always after the instrument has been switched off). Wait until 3 flashes are done. Click on white calibration (every morning and always after the instrument has been switched off) after another person has placed the white calibration piece under the measurement window (white ring). Wait until the flashes are done.
7. Click: ok
8. Now the Logger Control panel appears: with the acoustic motor in manual mode, adjust the spectrophotometer in the way that it touches the surface of the section and that the upper transducer escapes 5 to 10 mm in the housing (while touching the sediment surface). Put the motor back to automatic mode.
9. Click: ok, then type 25 or 40 (depending on the morphology of the surface), and click ok again: wait until the acoustic motor drives up the spectrophotometer for the chosen distance. Make sure that the spectrophotometer has got enough space between surface and measurement-window (white ring). It must be avoided that a core section can bump into the spectrophotometer.
10. With the pusher motor in manual mode move the pusher to the reference point (blue). Put the motor to automatic mode and click ok.
11. With the scroll bar move the pusher to the nominal position.
12. Place the section (covered with Hostaphan foil), adjust if necessary with the scroll bar and click on “begin scan”.
13. When the pusher comes to the reference point, it moves automatically back.
14. Place next section, adjust with the scroll bar if necessary and click on “begin scan”. Go on with the following sections.
15. When the last section of a core is almost done, use the dummy for pushing.
16. At the end of the core click on "File", "create ASCII file": save data in the right folder (same ID as the files).
17. Click on "Options", "Process data". A new panel appears.
18. Click on "Options", "Processing panel".
19. Click on "File", "create ASCII file": save in the right folder.
20.For the new core create a new folder. Continue with point 8.
More details ...
Turn off
Turn off the PC
Power off at microprocessor unit (below right)
Switch interface box off
Flip switch at the transformer box to "0".
| Scan time | ||
| 1.5 m section | Color reflectance only | Color reflectance + Munsell |
| 2 cm resolution | 16 min | 21 min |
| 2.5 cm resolution | 14 min | 17 min |
| 5 cm resolution | 8 min | 10 min |
| 6 cm resolution | 7 min 30 sec | 9 min |
| 8 cm resolution | 6 min 30 sec | 8 min |
| 10 cm resolution | 6 min | 6 min 30 sec |