
- Home
- Discover
- Ship's logs
- Ship's Log MSM 20/1
Ship's Log MSM 20/1
„Floating University“ MSM 20-1 started
The students will report in this Ship´s log on the work and life on board the research vessel.
Expedition logo
Saturday, January 14, 2012

Scientific crew on the working deck of RV Maria S. Merian (Photo: M. Maggulli).
Since this is the last day of our cruise, we are all quite busy; even more so than the normally busy pace of scientific life on board. Data needs to be backed up reliably, the Parasound profiles from last night need to be processed, multibeam data from the new device needs to be scrutinized, evaluated and fixed, examples and screenshots of interesting seafloor features need to be presented to the group, and of course, a cruise report needs to be written. As it is looking, we will have a full night of work ahead of us before reaching the port of Walvis Bay.
Therefore, we would like to say “good bye” to all our readers and thank captain Ralf Schmidt and the crew of RV Merian for their professional support and for the pleasant atmosphere on board, which makes the “Floating University” very successful.
Best regards,
Eva, Milen and the team of the “Floating University”
Final map of the discovered structure
Friday, January 13, 2012
To figure out whether these features are real or artifacts, the echosounder EM1002 was installed and used for multibeam mapping of the seafloor. Afterwards we went “canyon hunting”: the ship had to go several times over the canyon feature to see whether we could trace it with the multibeam echosounder and Parasound systems.
In order to correct the multibeam data we took another sound velocity profile. This was the first time that one of the students was in charge of the profile. Luckily it worked out well and we learned the proper way to communicate with the ship’s crew during station work.

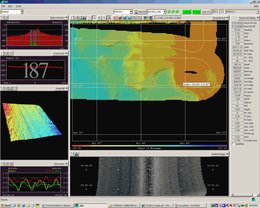
Map of research area for the last few days. Two interesting features on the seafloor are investigated. One of them could be a canyon; the other resembles a giant “footprint” that may be related to the mountain lying directly opposite the feature onshore Namibia.
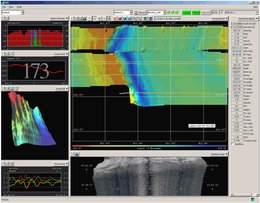
Where we had expected a canyon-like feature, we did not find one, however the structure that has been observed in figure on the right top looks like a step in the seafloor. The eastern part of the feature looks similar to a head-wall structure caused by submarine landslides (screenshot 3). The interesting thing about it is that the location of the feature is quite unusual. It is located in the middle of the shelf and the shelf break is therefore rather far away from the structure.
To map the whole feature we were doing a survey of parallel lines. As the mapping continues during the night the students on watch will be in charge of setting the course of the ship.
In the Parasound data we observed another interesting structure right beside the channel-like depression that appeared to be a sand body (screenshot 4).
Since there are so many open questions concerning the discovered structures, we will be mapping in this region until tomorrow. Hopefully, we will still have some time left afterwards to investigate the footprint structure.
In the afternoon it was possible for us to take a guided tour through the engine rooms. The most fascinating fact for us was that it is actually possible to steer the ship from the engine room. We also learned that the ship has two separate engines that can be operated independently in case of a failure.
The day was nicely rounded up by a barbecue and a little party afterwards.
Greetings from barbecue party,
Justine and Daniela
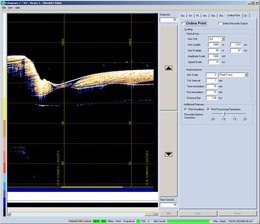
Screenshot 1 : Screenshot from parasound acquisition window while crossing the observed channel-like depression.
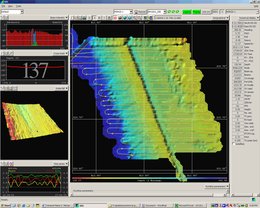
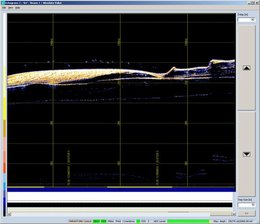
Screenshot 2 : Screenshot from multibeam EM1002 after several crossings of the observed feature. The blue coloured region represents the depression.
Screenshot 3 : Screenshot from multibeam EM1002 of the headwall-like feature we discovered in the area where we expected the canyon.
Screenshot 4 : Screenshot SLF parasound acquisition window shortly after crossing the depression. The observed structure beside the depression appears to be a sandbank.
Thursday, January 12, 2012

Satisfied OSB Team after recovering the last OBS from the seafloor.
Also the Floating University celebrated this day due to the fact that it “conquered” the vessel – at least in purpose of controlling all scientific research. The hydroacoustic systems (Parasound, Echolot) now will run uninterruptedly until reaching the harbour of Walvis Bay. Today one of these systems, the Atlas Parasound P70, is described in the following in order to provide some information for the student´s grandparents and Paul´s children!
Measurements with the Parasound Sedimentecholot are based on the so called “parametric effect”, which means that two primary high frequency signals (PHF) of 18 kHz and 22 kHz are transmitted by the system producing one secondary low frequency signal (SLF) of 4 kHz. The main advantages of this method are the high resolution as well as a relatively high penetration depth of the sea floor and its subsurface. An example is illustrated in the figure on right top.
This section of a profile taken on the 10th of January 2012 along the southern flank of the Walvis Ridge illuminates very clearly the upper 100 meters of wavy sediment structures, which can be observed in a water depth of approximately 1450 meters. These features give evidence for paleoceanographic variabilities in this environment, e. g. the direction of ocean currents.
Best Regards
Irena and Andre
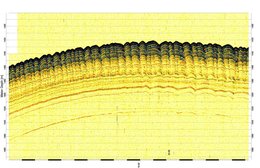
Parasound profile showing the sediment waves along the southern flank of the Walvis Ridge.
Wednesday, January 11, 2012
The day started with work as usual in our shift system (group 1: 0-4 am/0-4 pm; group 2: 4-8 am/4-8 pm and group 3: 8-12 am/8-12 pm). Today three OBSs were recovered over the day with the first OBS station at 2:29 am (UTC). This first station brought up a small visitor (photo top right) from the deep world of the sea bottom (depth around 2400 meter).
Over the last days we had many different lectures on data processing (e.g. introduction to Linux, working with sound velocity profiles, replaying of the parasound data with the ATLAS Parastore software). One of the main focuses for today was working with Linux based software GMT (Generic Mapping Tool) and the interpretation of sound velocity profiles.

Students of the ‘Floating University’ working together in the data processing room.
(Foto: Gesa Barkawitz)
The SVPs can be used in two different ways. Directly, during data acquisition, when loading the SVP into the MBES acquisition software SIS. Second, for correcting the data during post processing.
With reference to the SVP graph shown on the right, one can see two examples from our cruise. Profile 1, measured near Cape Town in South African waters (17.4309/-32.6684) and profile 3 (10.7780/-19.8904) measured in Namibian waters.
It is obvious that most changes appear in the first 200 meters of the water column, mainly due to temperature changes. The dashed lines (Profile 2/4) show an extract of the LEVITUS Database, approximately at the same positions as the measured profiles. Although there are differences, they show nearly the same trend as the profile recorded during this cruise.
Due to the fact that wrong sound velocity profiles produce channel like structures on the seafloor, it is very important to use the measured profiles. In the figure below you can see the difference between multibeam data being processed with a wrong sound velocity profile (left) and the same data being processed with the performed velocity measurement (right).
Sunny greetings from the Walvis Ridge, Monika and Gesa
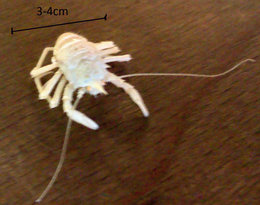
Visitor from the deeper sea (unfortunately there was no biologist on board to identify him).
(photo: André Vollmert)
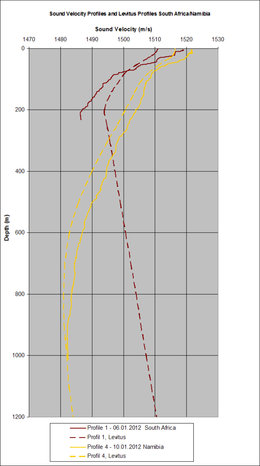
Comparison between measured SVP and profile generated from the LEVITUS database

Difference between processed multibeam data with (left) an old SVP and (right) the measured SVP.
Tuesday, January 10, 2012
Furthermore the 4th velocity- and temperature profile was logged with a Sound Velocity Tool (SVT) and presented in a diagram with the former data. There was a clear difference between the shallow water (230 meter) profile collected off South Africa and the deep water (1000-1800 meter) profiles collecting off Namibia regarding sound velocity and temperature.
Processing of the bathymetric data was continued, so we could start the velocity correction in the evening and created the first pictures of the sea bottom using the processed data.
Finally we had the opportunity to be creative and each group designed a cruise logo. Here you can see the winner logo and the other proposals:
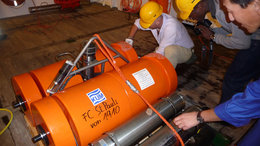
The OBS "FC St. Pauli" is back onboard.
(photo: D. Wolf)


Proposals for the expedition logo; the winner logo (left) became the official logo of this cruise.
The day ended with a fantastic sun rise and the recovery of the OBS “FC St. Pauli“.
Janina and Sofia
Monday, January 9, 2012

The ocean-bottom seismometer (OBS) is recovered
Best regards from Walvis Ridge,
Johanna and Timo
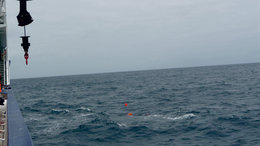
The ocean-bottom seismometer (OBS) at the sea surface
Friday, January 6th, till Sunday, January 8th, 2012
The main goal of leg MSM20-1 is the recovery of twelve broadband ocean-bottom seismometers which were deployed during MSM17-2 in January 2011 around the intersection of the Walvis Ridge with the continental margin. This project is funded by the German Research Foundation within the SAMPLE priority program. Detailed information can be found (Link zum Fahrtenheft, Leitstelle). Moreover this cruise is used to train 12 students from Germany and Namibia in shipborne hydroacoustic techniques within a so called “floating university” powered by the University of Bremen/MARUM and GEOMAR (Kiel).
Due to a permit of the South African authority we were able to start our lessons right after leaving the port with the acquisition of multibeam and subbottom profiling. Beside the introductions to the hydroacoustic systems, the first days have been used to get familiar with live on board, watching in shifts and working on a moving platform. Part of this familiarization was an exciting security training (see picture).

Security training on board RV Maria S. Merina
(Photo: P. Wintersteller)
During the next days the students will continue this blog.
With best regards from the South Atlantik,
Paul, Tilmann and Willi
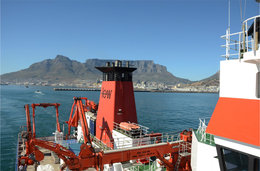
RV Maria S. Merian is leaving Cape Town on a sunny but windy morning
(photo: P. Wintersteller)