- Home
- Discover
- Archive News
- News 2021
- GLOMAP
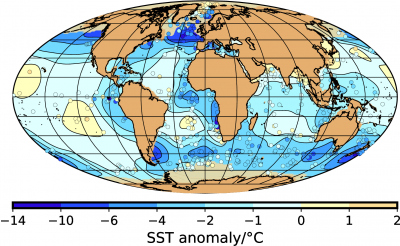
New world map of sea-surface temperature and sea-ice extent during the Last Glacial Maximum
GLOMAP shows how sea surface temperatures and sea ice changed at the time of the Last Glacial Maximum (LGM) as compared to today, and it provides the basis for future simulations of the atmospheric circulation with climate models. Such models help researchers visualize climate changes and test them against additional, independent data from the past.
The paleodata are based on samples obtained from deep-sea sediment cores. In particular, abundances of planktonic microorganisms were used for GLOMAP. In addition, biomarker data were taken into account to reconstruct the paleo-sea ice distribution in the Arctic. However, there are gaps in sampling. Data points exist only where deep-sea cores could be obtained. Therefore, sufficient data are not available for all ocean areas.
Therefore, for GLOMAP, the authors applied a new method from physical oceanography for the first time to create a comprehensive representation of mean sea-surface conditions for the time period between 23,000 to 19,000 years ago from the sparse and scattered data. Data gaps were filled using statistical relationships so that a complete coverage of the world ocean could be achieved. The method also provided an indication of the uncertainty in temperature change, which depends on data coverage and errors in the raw data.
The temperature change averaged over the entire world ocean provides an estimate of the sensitivity of the climate system to changes in the Earth's radiative budget due to the large continental ice sheets and the decrease in greenhouse gas concentrations during the LGM. Currently, global warming due to a doubling of the atmospheric CO2 concentration is assumed to range between 2.6 and 4.1 °C. Paleodata such as GLOMAP argue for a value in the middle of this range and against a very high climate sensitivity.
André Paul, Stefan Mulitza, Rüdiger Stein, Martin Werner: A global climatology of the ocean surface during the Last Glacial Maximum mapped on a regular grid (GLOMAP), Clim. Past, 17, 805–824, https://doi.org/10.5194/cp-17-805-2021, 2021.


