Workshop on machine learning approaches for automating geological correlation
Introduction
Quick facts
When?
30 November – 2 December 2022, 09:00 – 13:00
Where?
MARUM, seminar room 2060-2070 & online
Participants?
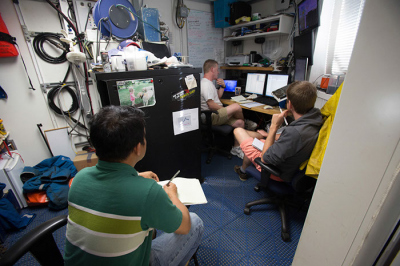
The workshop was attended by 19 in-person and 9 online participants. This group of people was very diverse and international, with scientific interest ranging from stratigraphy to machine learning, paleoceanography and dynamic time warping (DTW).
Costs?
The workshop was free of charge for all participants, and three DTW specialists were invited thanks to the financial support of the MARUM Cluster of Excellence.
Contact?
The workshop was open to everyone interested in stratigraphy, machine learning, dynamical time warping. Please send an email to: [Bitte aktivieren Sie Javascript] or [Bitte aktivieren Sie Javascript].
Outcomes
The workshop explored different numerical techniques that allow for automating the correlation of multiple geologic depth- or time-series using dynamic time warping (DTW). The workshop was designed around a case study offshore Australia, for which participants tested different software packages under the guidance of their respective developing experts. The main goal was to correlate industrial wireline logs with scientific wireline logs.
The numerical tools in question were:
- MyDTW
https://paloz.marum.de/dtwBook/myDTW.html
- The dtw R-package / Python package
https://dynamictimewarping.github.io/
- ChronoLog by Zoltán Sylvester (not publicly available, but check out Zoltán’s GitHub page for more information https://github.com/zsylvester)
MyDTW
MyDTW is a computer program that is implemented as a cross-platform graphical user interface (GUI), designed by Heiko Pälike and Sergey Kotov (MARUM, Bremen). In the presented case study, participants appreciated the program’s ease of use, as well as its intuitive parameter settings. The latter is mainly due to the fact that this program was designed explicitly for geological applications: The user defines minimum and maximum sedimentation rates, provides local constraints (e.g., from biostratigraphy) and decides whether or not hiatuses are expected, which are then translated into the appropriate rules for calculating the accumulate cost matrix. Participants also appreciated the possibility of pre-processing (resampling, detrending and bandpass filtering) the data-series within the GUI.
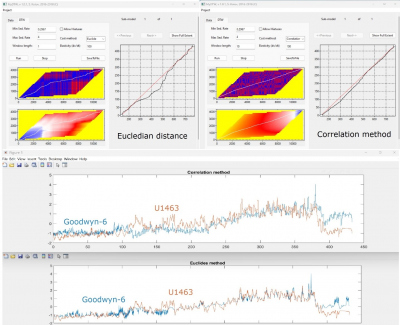
During the workshop, participants explored different methods to quantify the match between the two series (correlation vs. Euclidian distance) and concluded that -in the case of the Australian wireline logs- the correlation method provided more satisfying results (Figure 1). Two participants experimented with the application of MyDTW to their own data: Ziye Li (MARUM, Bremen) correlated a late Pleistocene benthic isotope record to the LR04 benthic isotope stack, whereas Matthias Sinnesael and Kilian Eichenseer (Paris and Durham, respectively) looked for the best match between two Cambrian d13Ccarb series.
We concluded that MyDTW is the perfect tool to familiarize oneself with the general concept of dynamical time warping and its application in stratigraphy. While MyDTW is probably not the most efficient option to automatically correlate hundreds of industrial wireline logs offshore Australia, Heiko Pälike and Ewa Burwicz-Galerne plan to further optimize and expand MyDTW based on the lessons learned during the workshop.

Figure 1: Correlation between Goodwyn-6 (industry log) and U1463 (IODP log) with MyDTW, comparing the correlation and Euclidian cost method.
dtw R-package / Python package
The packages dtw for R and dtw-python for Python provide a complete and freely-available implementation of Dynamic Time Warping (DTW). The packages have been designed, made available and documented by Toni Giorgino (Milan). Using the Australian case study, workshop participants greatly valued the versatility of the package. For example, the possibility to carry out partial matches (open-begin and open-end) was considered an important feature for geologic correlations. Moreover, it became rapidly clear that stratigraphic constraints (e.g., biostratigraphic datums or marker horizons) could be best provided to the dtw package by means of a windowing function.
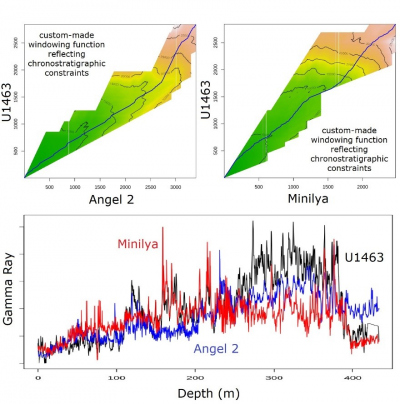
On the second and third day of the workshop, participants experimented with designing geologically-meaningful windowing functions. Working together (special thanks to Emilia Jarochowska (Utrecht) and Michiel Arts (Liège)!), we succeeded in writing an R function that automatically generates a windowing function based on some rough user-defined stratigraphic divisions (Figure 2).
The workshop participants agreed that the dtw R-package, combined with the new windowing function described above, currently is the preferred tool to automate stratigraphic correlation between hundreds of industrial and scientific wireline logs offshore Australia. After the workshop, Toni Giorgino, Emilia Jarochowska and David De Vleeschouwer continued exploring possible solutions to the problem using multi-time-series warping. This collaboration led to a new R package called dtwMultiAlign, providing the simultaneous alignment of several timeseries at once and returning a single alignment curve. It aligns multiple timeseries by stretching or expanding each of them to minimize the total residual distance (defined by customizable distance functions). The method generalizes the dynamic time warping (DTW) algorithm to the multiple-timeseries case; it can be thought of as an analog for real-valued timeseries of multiple sequence alignment algorithms.

Figure 2: Correlation between Angel-2, Minilya (industry logs) and U1463 (IODP log) with the dtw R package, using the windowing-function that was created during the workshop.
ChronoLog
ChronoLog is a python-based software package that automates the workflow for correlating large numbers of geophysical well logs. Zoltán Sylvester (Austin, Texas) has written and tested the software primarily to correlate closely-spaced (0.1 – 10 km scale) well logs with relatively simple stratigraphy. In such settings, the results outperform manual interpretations. Furthermore, ChronoLog is designed to deal with a major problem that plagues well-pair correlations. The problem with well-pair correlations is that errors accumulate as the correlation progresses along a path. Now consider a loop of well logs. If one carries out correlation along the loop, the first well is the same as the last well and therefore those two well logs should perfectly align. Yet, this theoretical expectation is often not achieved. ChronoLog solves this problem by calculating a chronostratigraphic diagram, stretching and squeezing all logs into a chronostratigraphic diagram.
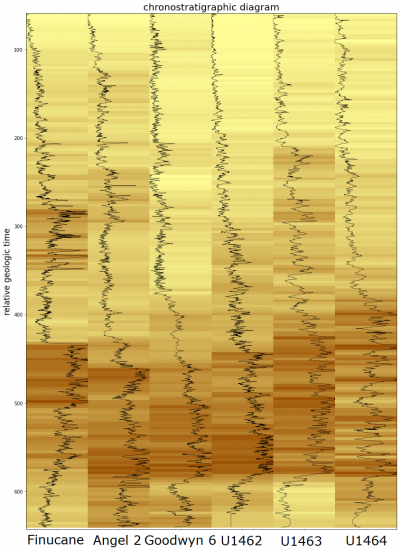
When the ChronoLog software is applied to the Australian case study, two-site correlations produce satisfying results. However, the multi-site chronostratigraphic chart that was produced during the workshop fell short of establishing convincing correlations (Figure 3). There are several reasons for this. In its current version, ChronoLog does not allow for partial correlations (open-end and open-begin), nor did we consider chronostratigraphic constraints. While ChronoLog has been designed for correlation on smaller geographical scales, the Australian test dataset required correlations over several 100’s of kilometers.
One promising way forward could be to apply thedtw-pythonpackage into ChronoLog instead of the relatively simple dtw function that is currently adopted. That way, one would have access to all the built-in features of dtw-python, in particular partial correlations and the windowing function, when constructing the chronostratigraphic chart using ChronoLog.

Figure 3: Correlation between Angel-2, Finucane, Goodwyn-6 (industry logs), U1462, U1463 and U1464 (IODP logs) within a chronostratigraphic diagram, produced by the ChronoLog software.
Workshop programm
|
30.11.2022 |
||
|
09:00 – 09:30 |
Introduction |
David De Vleeschouwer |
|
09:30 – 10:10 |
MyDTW – Principles and implementation |
Heiko Pälike |
|
10:10 – 10:30 |
Coffee Break |
|
|
10:30 – 11:10 |
R packagedtw– Principles and implementation |
Toni Giorgino |
|
11:10 – 12:00 |
ChronoLog – Principles |
Zoltan Sylvester |
|
12:00 – 12:30 |
Setting up ChronoLog for beta testing |
Zoltan Sylvester |
|
13:00 – 14:00 |
Lunch at Haus am Walde (10 minutes walk) |
All in-person participants |
|
01.12.2022 |
||
|
09:00 – 10:30 |
Application of MyDTW and dtw (R-package) to Australian data |
D. De Vleeschouwer & H. Pälike & Toni Giorgino |
|
10:30 – 11:00 |
Coffee Break |
|
|
11:00 – 11:30 |
ERC Starting grant 'Mind the Gap' |
Emilia Jarochowska |
|
11:30 – 13:00 |
Application of ChronoLog to Australian data |
D. De Vleeschouwer & Z. Sylvester |
|
02.12.2022 |
||
|
09:00 – 10:30 |
Break-out in three groups (ChronoLog / MyDTW / dtw) to identify strengths and weaknesses of individual approaches. |
|
|
10:30 – 11:00 |
Coffee break |
|
|
11:00 – 12:30 |
Each group presents the advantages/disadvantages of three different tested approaches. Group discussion on which tool is most useful. |
|


