- Startseite
- Abrupt Climate Change
Abrupt Climate Change
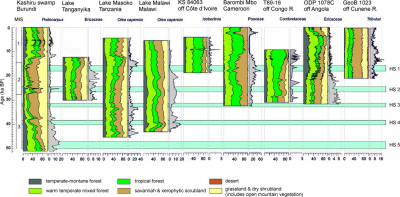
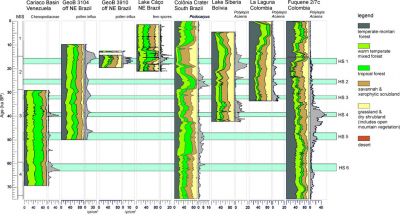
The response of tropical vegetation around the Atlantic Ocean to abrupt climate change markedly differs from region to region. In South America drier vegetation occurs during Heinrich Stadials (HS) in the northern part, which is at present under the influence of the Intertropical Convergence Zone, while wetter vegetation extends in Northeast Brazil, which lies nowadays south of the influence of Intertropical Convergence Zone. In Africa, a change to drier vegetation is found mainly in West Africa north of the equator and in East Africa. The Younger Dryas (YD) exhibits a rather heterogenous vegetation response.
HS in tropical Africa
HS in tropical South America
Model-Data comparison
Millennial-scale changes in vegetation records from tropical Africa and South America during the last glacial
Hessler I, Dupont L, Bonnefille R, Behling H, González C, Helmens KF, Hooghiemstra H, Lebamba J, Ledru MP, Lézine AM, Maley J, Marret F, Vincens A
Quaternary Science Reviews 29 (2010) 2882-2899
doi:10.1016/j.quascirev.2009.11.029
Tropical vegetation response to Heinrich Event 1 as simulated withthe UVic ESCM and CCSM3
Handiani D, Paul A, Prange M, Merkel U, Dupont L, Zhang X
Climate of the Past 9 (2013) 1683-1696
doi:10.5194/cp-9-1683-2013
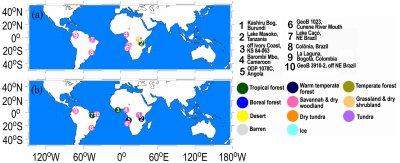
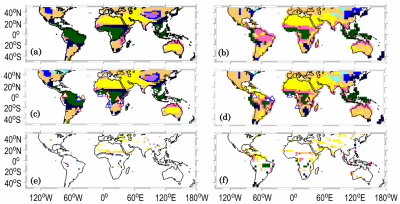
Tropical climate and vegetation changes during Heinrich Event 1: a model-data comparison
YD and HS1 in East Africa
Northern Hemisphere control of deglacial vegetation changes in the Rufiji uplands (Tanzania)
Bouimetarhan I, Dupont L, Kuhlmann H, Pätzold J, Prange M, Schefuß E, Zonneveld K
Climate of the Past 11 (2015) 751-764
doi:10.5194/cp-11-751-2015
HS 1 in West Africa
Sahel megadrought during Heinrich Stadial 1: Evidence for a three-phase evolution of the low- and mid-level West African wind system
Bouimetarhan I, Prange M, Schefuß E, Dupont L, Lippold J, Mulitza S, Zonneveld K
Quaternary Science Reviews 58 (2012) 66-76
doi:10.1016/j.quascirev.2012.10.015
Low- to high- productivity pattern within Henrich Stadial 1: Inferences from dinoflagellate cyst records off Senegal
Bouimetarhan I, Groeneveld J, Dupont L, Zonneveld K
Global and Planetary Change 106 (2013) 64-76
doi:10.1016/j.gloplacha.2013.03.007
HS around Cariaco Basin
As in West Africa the climate of the Heinrich Stadials in northern South America were dry.
Neotropical vegetation response to rapid climate changes during the last glacial period: Palynological evidence from the Cariaco Basin
González C, Dupont LM, Behling H, Wefer G
Quaternary Research 69 (2008) 217-230
doi:10.1016/j.yqres.2007.12.001
Reconstructing marine productivity of the Cariaco Basin during marine isotope stages 3 and 4 using organic-walled dinoflagellate cysts
González C, Dupont LM, Mertens K, Wefer G
Paleoceanography 23 (2008) PA3215
doi:10.1029/2008PA001602
YD & HS1 in Northeast Brazil
In contrast to northen South America or West Africa, the climate in Northeast Brazil was much wetter during the Younger Dryas and the Heinrich Stadials. The Intertropical Convergence Zone shifted southwards providing Northeast Brazil with rain.
Intermittent development of forest corridors in northeastern Brazil during the last deglaciation: Climatic and ecologic evidence
Bouimetarhan I, Chiessi CM, González-Arango C, Dupont L, Voigt I, Prange M, Zonneveld K
Quaternary Science Reviews 192 (2018) 86-96
doi:10.1016/j.quascirev.2018.05.026
Two-step vegetation response to enhanced precipitation in Northeast Brazil during Heinrich event 1
Dupont LM, Schlütz F, Teboh Ewah C, Jennerjahn TC, Paul A, Behling H
Global Change Biology 16 (2010) 1647-1660
doi: 10.1111/j.1365-2486.2009.02023.x
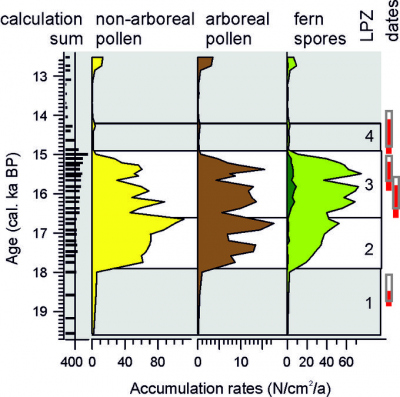
The strong increase in the accumulation rates of pollen and spores is the combined result of higher pollen production by a more lush vegetation (forest) and increased run-off indicating increased precipitation during Heinrich Stadial 1. The icrease in tree fern spores during the upper part (Zone 3) indicates a second phase of Heinrich Stadial 1 being wetter than the first phase.
YD and HS in Angola and Namibia
The situation during the Younger Dryas and the Heinrich Stadials is again different in west southern Africa. Although the sea surface temperatures show a clear signature of these periods, the climate and vegetation on land do not seem to change accordingly.
Masked millennial-scale climate variations in southwest Africa during the last glaciation
Hessler I. Dupont L, Handiani D, Paul A, Merkel U, Wefer G
Climate of the Past, 8 (2012) 841-853
doi:10.5194/cp-8-841-2012
Impact of abrupt climate change in the tropical southeast Atlantic during Marine Isotope Stage 3
Hessler I, Steinke S, Groeneveld J, Dupont L, Wefer G
Paleoceanography 26 (2011) PA4209
doi:10.1029/2011PA002118
Land-sea linkages during deglaciation: High resolution records from the eastern Atlantic off the coast of Namibia and Angola (ODP Site 1078)
Dupont LM, Behling H
Quaternary International 148 (2006) 19-28
doi:10.1016/j.quaint.2005.11.004
Southwest African climate independent of Atlantic sea surface temperatures during the Younger Dryas
Dupont LM, Kim JH, Schneider RR, Shi N
Quaternary Research 61 (2004) 318-324
doi:10.1016/j.yqres.2004.02.005
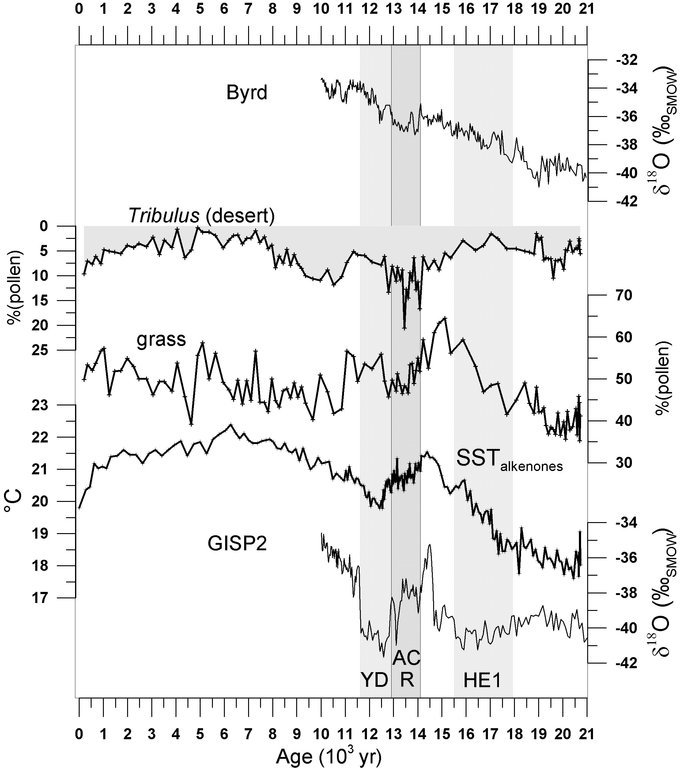
Correlation between vegetation in Southwestern Africa and oceanic upwelling in the past 21,000 years
Shi N, Dupont LM, Beug HJ, Schneider R
Quaternary Research 54 (2000) 72-80
doi:10.1006/qres.2000.2145
Sea level change
The timing of sea level changes during the Heinrich Stadials can be estimated through the registration of the vegetation succession around the Cariaco Basin in northern South America. The saltmashes make way for reedlands when sea level rizes. The reedlands, in turn, change to sedge swamps when sea level falls again.
Tropical salt marsh succession as sea-level indicator during Heinrich events
González C, Dupont L
Quaternary Science Reviews 28 (2009) 939-946
doi:10.1016/j.quascirev.2008.12.023
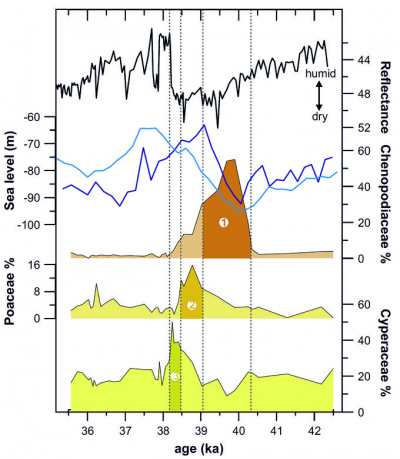
Impacts of rapid sea level rise on mangrove deposit erosion: Application of taraxerol and Rhizophora records
Kim JH, Dupont LM, Behling H, Versteegh GJM
Journal Quaternary Science 20 (2005) 221-225
doi:10.1002/jqs.904
Taraxerol and Rhizophora pollen as proxies for tracking past Mangrove ecosystems
Versteegh GJM, Schefuß E, Dupont L, Marret F, Sinninghe Damsté J, Jansen F
Geochimica et Cosmochimica Acta 68 (2004) 411-422
doi:10.1016/S0016-7037(03)00456-3


